Executive Summary
Supply chains are entering a structural transition, not a cyclical swing. The last three decades were dominated by centralized sourcing, labor-cost arbitrage, and relentless optimization of one global network. This logic is being challenged by five primary forces: geopolitical fragmentation, automation and AI, the changing economics of energy, carbon, and route security, critical mineral and resource scarcity, and the regulatory drive toward circularity and reverse logistics.
Three cross-cutting amplifiers intensify or moderate these forces across every scenario: the physical infrastructure required to build and run the AI layer itself, the financial and insurance architecture of global trade, and the combined pressures of climate disruption and demographic decline.
Fragmentation is no longer just about tariffs. It is increasingly being expressed through sanctions, export controls, foreign-investment screening, industrial policy, domestic-content rules, technology restrictions, and the weaponization of data and AI model access across blocs. Companies are not facing a less liberal trade environment; they are facing the tightening link between trade and geopolitics that now extends into the digital infrastructure layer.
At the same time, automation and AI are becoming more prevalent in industrial practice, though adoption remains uneven. Agentic AI — systems that can autonomously plan, execute, and adjust supply chain workflows — is moving from research concept to early deployment. Yet the bottleneck remains organizational: data quality, process redesign, governance, and confidence in AI-supported decisions.
Energy and transport economics should now be treated as strategic variables. Shipping decarbonization rules are becoming mandatory, not voluntary. Carbon pricing coverage is widening. Meanwhile, chokepoint disruptions in routes such as Suez and continued route uncertainty in the Red Sea and the Strait of Hormuz remind companies that the economics of distance depend not only on fuel prices but on geopolitics and operational reliability.
A less visible aspect is the physical infrastructure required to power the AI revolution itself. Data centers — the backbone of every AI-native planning system — depend on massive electricity supply, water for cooling, copper for cabling, silicon for GPUs, and skilled people to build them. This creates a new resource pyramid: whoever controls the physical foundation layers controls the intelligence layers above. For supply chain leaders, AI is not only a tool to manage complexity; it is itself a supply-chain-intensive asset with its own sourcing, energy, and labor dependencies.
We analyzed four distinct scenarios to predict the future of supply chains, where the near-term evidence points to two worlds: Fragmented & Autonomous as the primary case, and Green & Constrained as the strongest adjacent case. Autonomous Flat World remains a plausible longer-term upside scenario and the one most likely to be reshaped by a transformative AI breakthrough. Stagnant & Exposed serves as the downside tail risk — a world where policy fragmentation deepens without the offsetting benefits of autonomy or green investment.
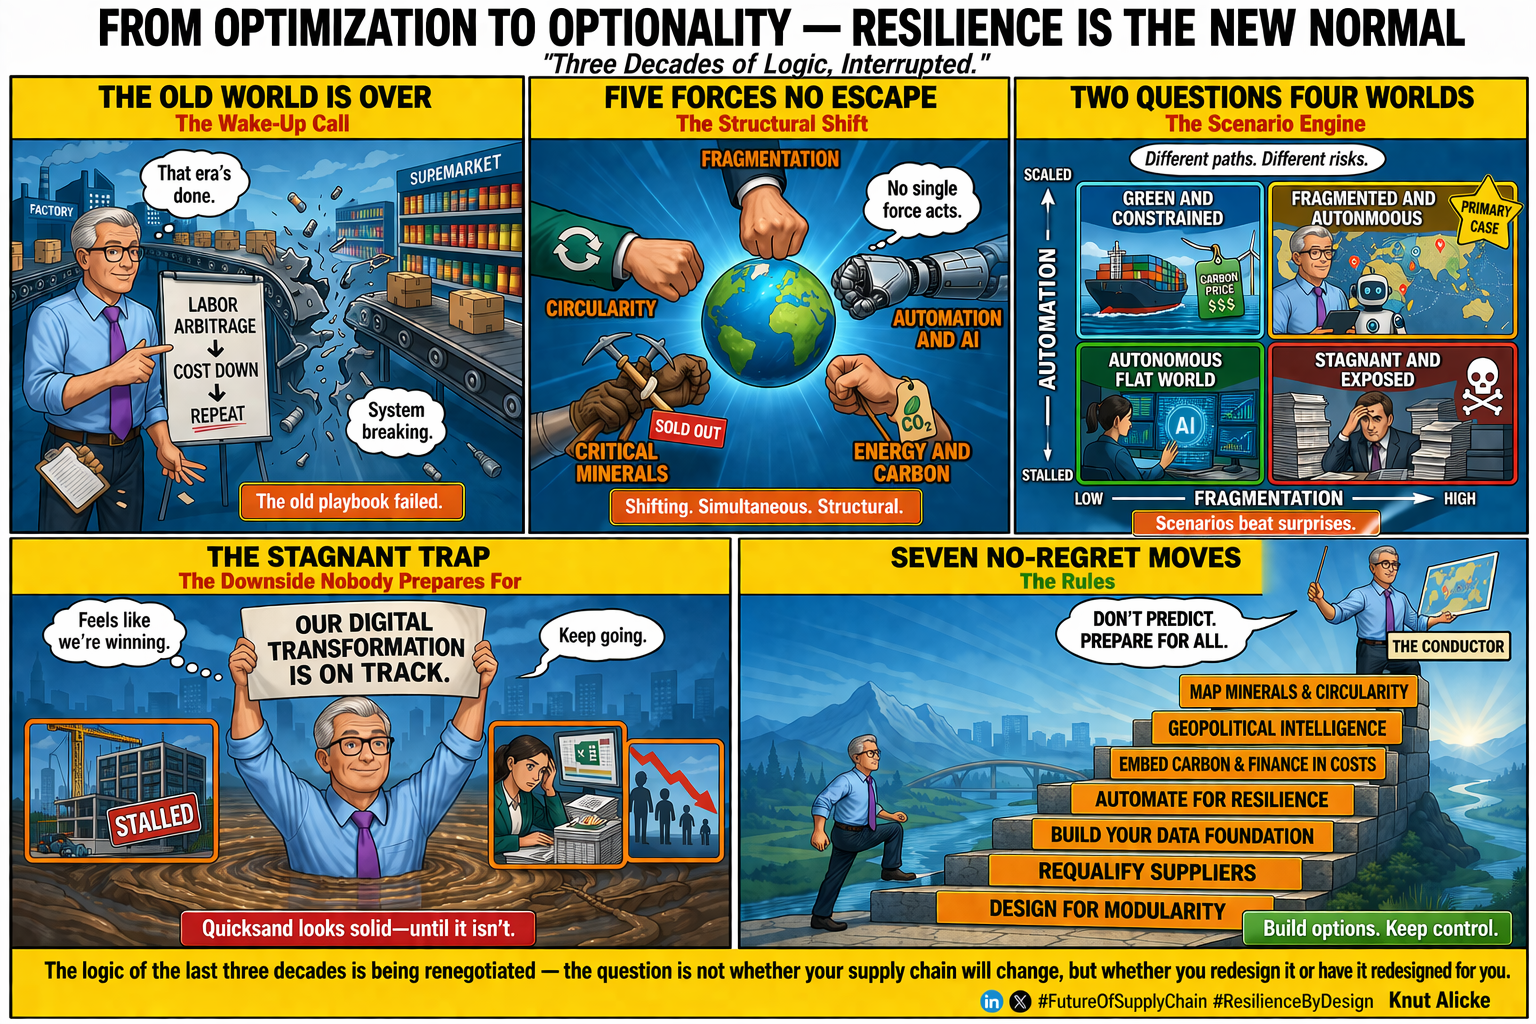
The practical implication is straightforward. Management teams should stop asking which single future will happen and start asking which future their current supply chain strategy is implicitly betting on. The task is to identify decisions that are robust across scenarios, distinguish them from concentrated bets, and build a monitoring system that shows when the planning case is changing.
Two ideas run through this paper that deserve explicit statement.
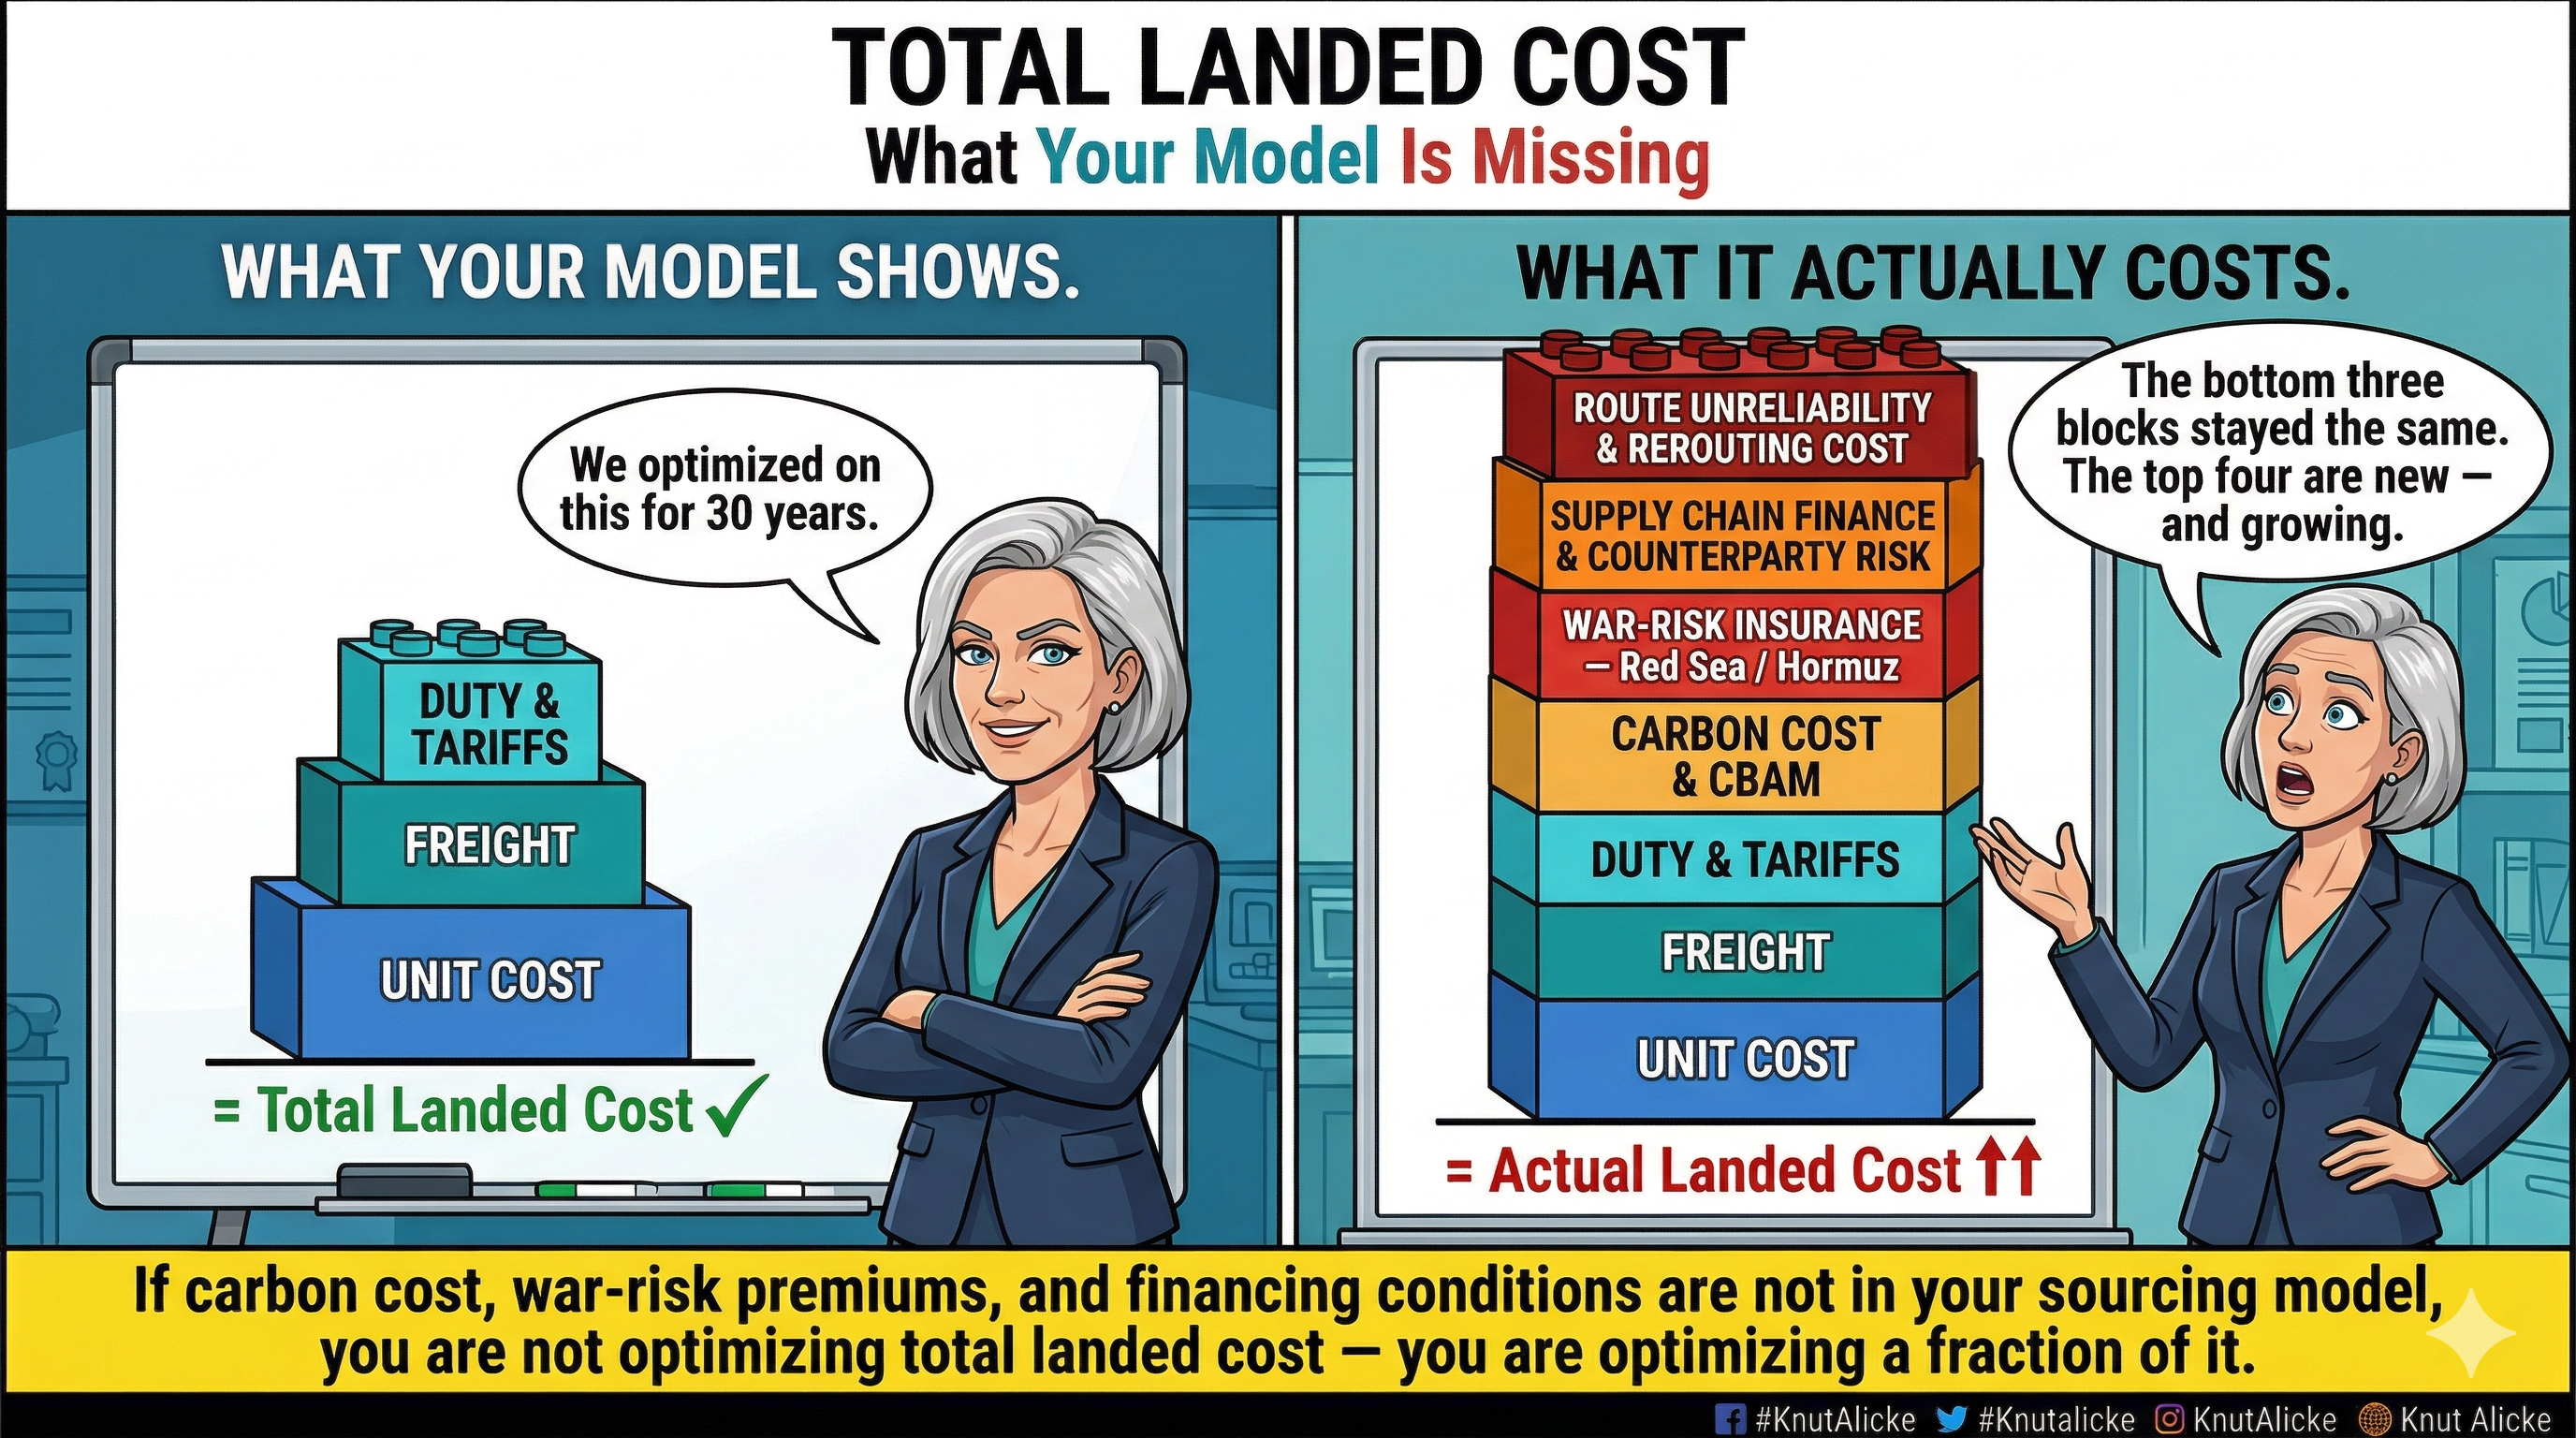
First, the competitive logic of supply chains in this environment is shifting from lowest total landed cost to lowest reconfiguration cost — the ability to restructure network architecture as the planning case shifts without stranding assets, breaking supplier relationships, or losing operational continuity. A network designed for minimum landed cost is point-optimized; a network designed for minimum reconfiguration cost builds modularity and optionality from the start.
Second, many companies may find that they decouple digitally and financially before they decouple physically. The control layer — data environments, AI models, compliance architectures, trade finance facilities, and insurance arrangements — may fragment before the physical flow of goods does. Shipping lanes may remain intact while the systems that govern, finance, and direct those lanes have already split along bloc lines. Decoupling risk must therefore be assessed not only at the level of where goods are made, but at the level of who controls the intelligence, compliance, and financial architecture that enable the supply chain to function.
1. Purpose and Use of the Framework
The question this paper answers is not what will happen but what we should decide now, given what might happen. It is a scenario-based strategic planning framework for supply chain design decisions up to 2040 — and it is most useful when leadership teams use it to interrogate five areas:
- Which future is their current network already betting on.
- Distinguish scenario-robust actions from scenario-specific bets.
- Surface irreversible choices that create lock-in or stranding risk.
- Establish a practical signpost system for monitoring change.
- Stress-test the organization against a world in which geopolitics deteriorates faster than technology matures.
Used well, the framework supports board discussions, annual strategy reviews, S&OP scenario reviews, network redesign programs, digital transformation decisions, and major capital allocation choices. It is most valuable when treated as a living planning instrument rather than a one-off thought piece.
2. Methodology and Scope
The framework is built in three steps:
- A broad set of macro-level forces is identified and screened for their impact on global supply chains.
- These forces are assessed across three impact dimensions: structural impact on network design, operational impact on planning and execution, and governance impact on compliance and policy exposure.
- The most decision-relevant uncertainties are used to construct strategically distinct worlds.
The framework does not assume that drivers are statistically independent. Geopolitical fragmentation shapes trade policy, export controls, and industrial policy. AI and robotics reinforce one another. Energy economics interact with both climate policy and transport technology. Critical mineral scarcity simultaneously constrains the pace of electrification, AI infrastructure build-out, and defense modernization. The aim is not mathematical independence, but strategic usefulness: a small number of high-priority drivers are used to generate worlds that are internally coherent and meaningfully different from a management perspective.
To help readers navigate the framework, the structural analysis distinguishes three types of drivers:
3. Structural Forces and Current Evidence
3.1 Fragmentation is becoming an economic-security architecture
Geopolitical fragmentation no longer appears primarily as a headline tariff escalation. It is increasingly expressed through a more institutionalized system of sanctions, export controls, investment screening, domestic-content mandates, and state-backed industrial policy. For supply chains, this fundamentally changes the design problem: network configuration becomes not only an economic but also a political, regulatory, and technology-access decision.
Trade patterns need to be interpreted more carefully than the simple phrase "decoupling" suggests. Some changes reflect reallocation of production and supplier footprints. Others refer to rerouting through connector countries — Vietnam, Mexico, India, Turkey, and others serving as intermediaries between blocs. The durability of these rerouting strategies is itself becoming a strategic question, as several connector countries come under active scrutiny for transshipment and circumventing rules of origin. A China+1 strategy is only as strong as the "+1"'s structural independence.
3.2 Trade policy, industrial policy, and technology restrictions now operate together
Industrial policy should no longer be treated as a separate or secondary issue. Subsidies, local-content rules, capacity incentives, export restrictions, and security-of-supply measures increasingly operate as a single policy environment. Where it makes sense to produce, source, and invest is increasingly determined by government action rather than market forces alone.
The newest dimension of this policy convergence is the weaponization of data and access to AI models. Export controls on advanced semiconductors are well understood. Less appreciated, but potentially more consequential, are emerging restrictions on training-data flows, model-weight transfers, and AI-as-a-service access across blocs. This creates a plausible future in which companies operating in both US-aligned and China-aligned markets need not only dual physical supply chains for goods, but dual AI stacks — separate data environments, separate models, separate compliance architectures. The cost of this digital duplication is not yet widely modeled, but it may become as material as physical network duplication.
A related and underappreciated dimension is cybersecurity and digital supply chain risk. As supply chains become more AI-dependent, with agentic systems managing planning, procurement, and logistics execution, the attack surface expands structurally. The risk is not only data theft or ransomware; it is the integrity of the AI-supported decisions themselves. In a world of dual AI stacks and digitally instrumented material flows, cybersecurity is no longer an IT issue — it is a supply chain continuity issue.
3.3 Automation and AI are real, but adoption remains two-speed
Automation and AI are the main counterforces to fragmentation. Industrial robot deployment remains high globally, warehouse automation continues to scale among leading firms, AI investment is accelerating sharply, and agentic AI is moving from concept to early deployment. We see three layers of the automation story:
- Proven automation at scale — industrial robotics, warehouse AMRs, and conventional planning tools. Real and growing, though regionally concentrated; Asia accounted for roughly 74% of new robot deployments in 2024.
- AI-augmented decision-making — demand sensing, exception management, scenario planning, and optimization. Capability is advancing rapidly, but enterprise deployment remains constrained by organizational readiness: data quality, process redesign, governance, and human confidence in AI-supported decisions.
- Speculative but worth monitoring — humanoid robotics, fully autonomous warehousing, and AI that fundamentally replaces rather than augments human coordination. An option-value story, not a planning baseline.
The central operational question is not whether AI or robotics will improve. It is whether companies build the data model, governance, digital process redesign, and leadership confidence required to industrialize them. The next decade is likely to widen the gap between leaders and laggards.
3.4 Energy, carbon, and route security are strategic variables
Energy and carbon are no longer background assumptions. Carbon pricing now covers around 28% of global emissions and generated over $100 billion in government revenue in 2024. Shipping decarbonization is moving globally through the IMO 2023 strategy and 2025 net-zero framework. Heavy-freight electrification is improving — electric medium- and heavy-duty truck sales exceeded 90,000 in 2024, growing nearly 80% year-on-year. At the same time, route security and chokepoint reliability matter more than many cost models assume: Suez tonnage remained about 70% below the 2023 average by May 2025, and the Strait of Hormuz carries roughly 11% of maritime trade and over one-third of seaborne oil exports.
The economics of distance are being shaped simultaneously by carbon, fuel, electrification, and geopolitics. But there is a less visible dimension: supply chain finance and insurance are becoming structural forces. War-risk insurance premiums for vessels transiting the Red Sea and Gulf of Aden have risen dramatically since late 2023. Route economics now include not just fuel and carbon, but insurance, financing, and counterparty risk as first-order variables.
3.5 The AI infrastructure supply chain: a new resource pyramid
Here is something that should bother every supply chain leader, but rarely gets stated plainly: the AI systems we are counting on to manage supply chain complexity are themselves among the most supply-chain-intensive assets ever built. We see this as a resource pyramid with four layers:
- Layer 1 — the physical foundation: electricity (massive, 24/7), water for cooling, buildings, oil for backup generators, copper for cabling, steel and concrete, silicon and rare earths for GPUs, and skilled people — electricians, plumbers, construction workers, civil engineers.
- Layer 2 — data center infrastructure: servers, cooling systems, connectivity, dominated by a small number of hyperscalers.
- Layer 3 — AI models: training, inference, and foundation models, again concentrated among hyperscalers and a handful of labs.
- Layer 4 — the intelligence: applications, agents, and decisions that sit atop everything below.
The thesis is straightforward: whoever controls Layers 1 and 2 controls Layers 3 and 4. Platform-economy logic meets resource scarcity. Sovereignty is not created in the model; it is created in the foundation.
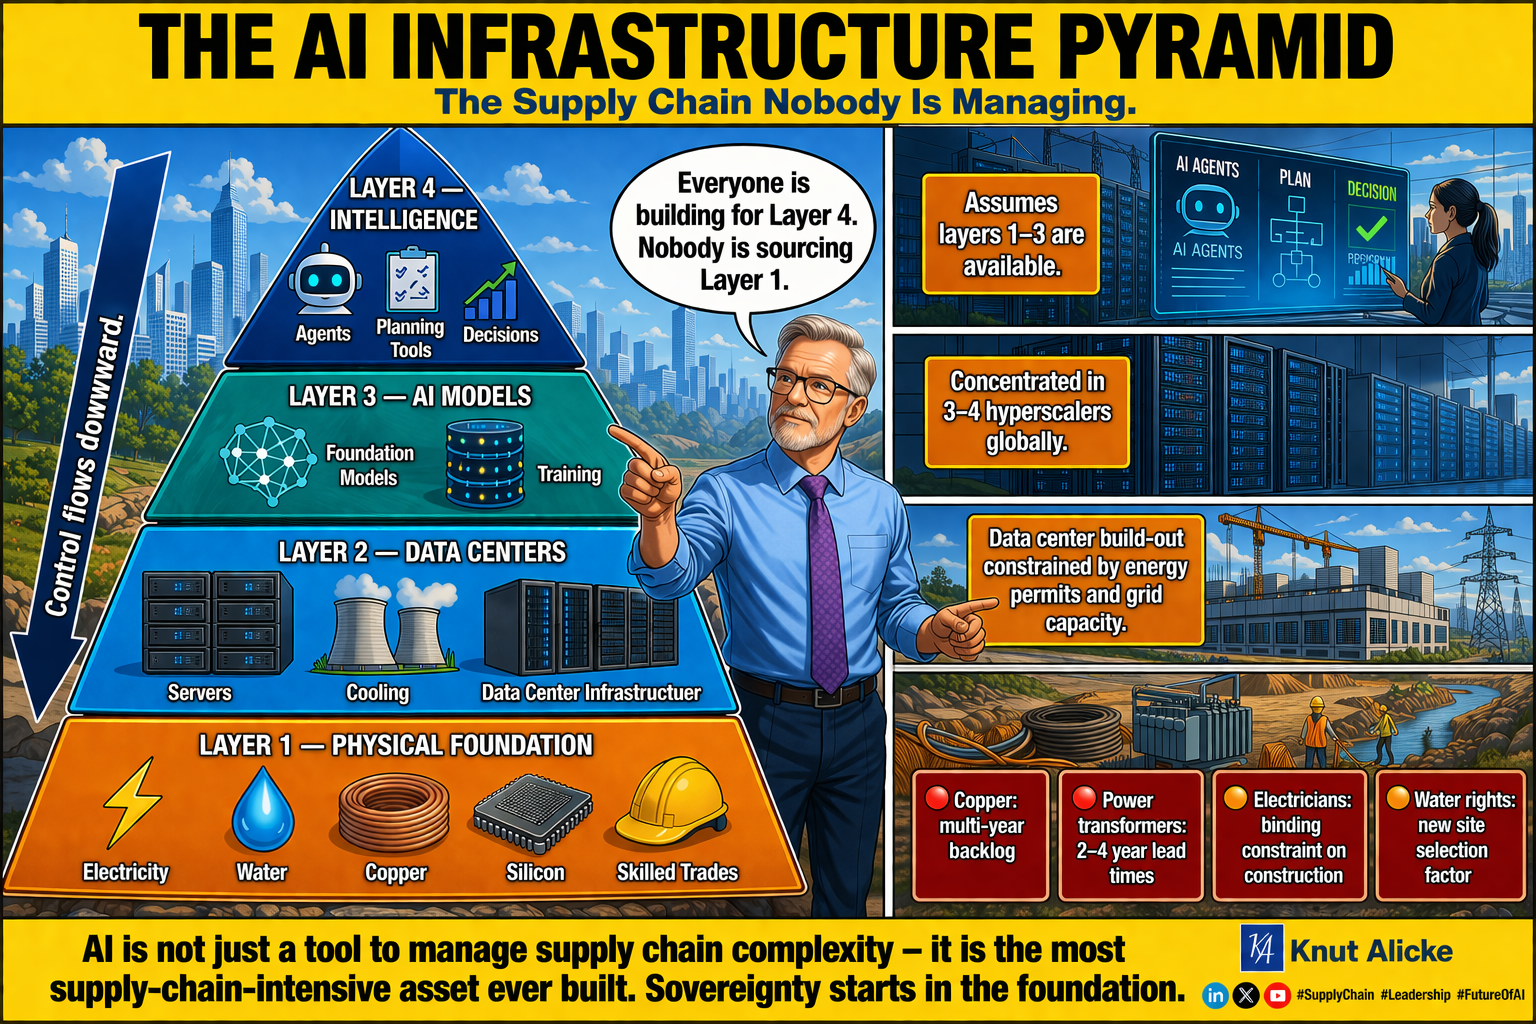
The supply chain implications are significant: commodity shocks are appearing in unexpected categories (copper and power transformers are on multi-year backlogs, not just chips); power transformers and high-voltage switchgear have become new strategic goods with 2–4 year delivery times; skilled labor is emerging as a constraint that may slow data center rollout more than chip shortages; energy is being reevaluated as a location factor; and the winner-takes-all dynamic in AI creates concentration risk in the supply network.
3.6 Climate disruption and demographics deserve more weight
Physical climate disruption and workforce demographics remain amplifiers in the scenario engine, but their narrative weight should increase. The climate signal is no longer just future-oriented; it is already visible in route disruption, infrastructure stress, insurance pressure, and operational volatility. The demographic signal is stronger than a generic labor-tightness story: OECD projections show an 8% decline in working-age population from 2023 to 2060, with many East Asian and Central/Eastern European countries facing declines above 30% — Korea up to 46%. This is a structural force that makes automation investment, migration policy, and workforce strategy more strategically relevant in every scenario.
3.7 Critical minerals and resource scarcity: the bottleneck beneath the bottleneck
The materials that underpin every major transition — electrification, AI infrastructure, defense modernization, and clean energy — are among the most geologically concentrated and geopolitically contested inputs in the global economy. The IEA's Global Critical Minerals Outlook 2025 shows the top three refining regions now control 86% of processing for copper, lithium, nickel, cobalt, graphite, and rare earths. China controls over 90% of the downstream value chain for rare earths and 94% of sintered permanent magnet production. When China imposed export restrictions on rare earths in April 2025, shipments fell 74% within weeks.
This is not a price-cycle problem that arbitrage can solve. It is a physical-resource constraint that independently reshapes network topology — forcing decisions with no precedent in the lean-global-network era: vertical integration backwards into mining and refining, long-term offtake agreements that look more like resource diplomacy than procurement, material substitution as a strategic R&D capability, and geographic diversification of processing capacity that runs directly against the cost logic of concentration.
Water cuts across multiple layers simultaneously. The Panama Canal drought disruptions of 2023–24 showed that water stress is a current operating constraint, not a future scenario. Semiconductor fabrication is highly water-intensive; data center cooling requires reliable, large-volume water supply; and one-third of global rice, wheat, and corn production occurs in highly water-stressed zones. Water is now a location factor for industrial supply chains in the same way energy already is.
3.8 Circularity and extended producer responsibility
The regulatory push toward circularity and extended producer responsibility is still treated by most strategies as a sustainability initiative rather than a network design problem. The evidence base has moved well beyond voluntary commitments: digital product passports (DPPs) will require full material traceability; the Ecodesign for Sustainable Products Regulation (ESPR) mandates repairability, recyclability, and recycled-content thresholds; the EU Deforestation Regulation (EUDR) requires commodity-level traceability; and extended producer responsibility schemes shift end-of-life costs onto producers and their supply chains.
The network design implications are substantial. Circularity creates entirely new reverse supply chains — return logistics, material recovery, and remanufacturing — that require dedicated infrastructure and different economics. The global reverse logistics market reached $841 billion in 2024 and is projected to grow over 7% annually through 2034. Companies implementing circular strategies report an average 23% profit-margin increase within three years, but the upfront investment in reverse infrastructure, modular product design, and digital traceability is significant.
4. Scenario Architecture
The five primary forces and three amplifiers do not combine randomly. Two of the five forces — fragmentation intensity and automation maturity — form the axes of the scenario architecture. The other forces act as modifiers of the economic logic within each world. The architecture is organized around two core uncertainties:
- Intensity of geopolitical fragmentation. Does the world move toward deeper bloc separation — with trade, technology, data, and capital increasingly organized along political lines — or does commercial pragmatism place limits on decoupling and keep cross-bloc networks viable?
- Maturity of automation and AI. Do AI and robotics, including agentic systems, become economically scalable operating tools that absorb the complexity of fragmented networks — or do infrastructure constraints and organizational barriers keep supply chains heavily dependent on manual coordination?
These two forces interact. High fragmentation with high automation produces a different world than high fragmentation with low automation — and the distinction determines whether network duplication is an affordable strategic choice.
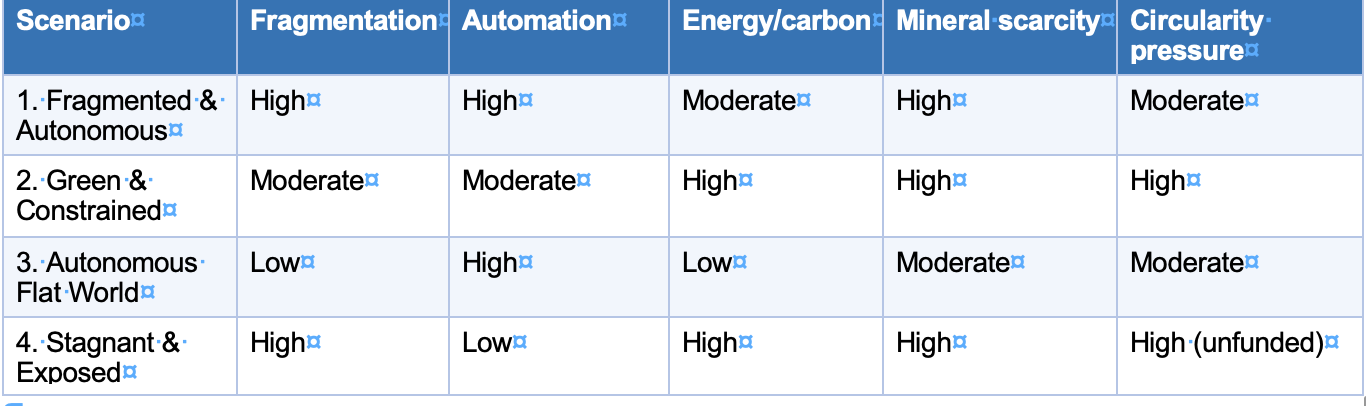
Fragmentation deepens enough to require regionally differentiated supply chains, but automation advances far enough to absorb the structural complexity and associated cost, making those networks economically manageable.
- Dual or multi-bloc supply chain designs in strategic categories; more regionalized footprints for politically sensitive products.
- AI-enabled planning, strong scenario management, and heavy use of robotics in distribution and production.
- High compliance burden, including dual data, trade, and supplier governance architectures — and dual AI stacks in some sectors.
- Connector countries under increasing scrutiny, forcing companies to verify the structural independence of alternative sourcing.
- Critical mineral supply chains reorganized along bloc lines; circularity mandates accelerating regional material loops.
Management risk. Underestimating the operating overhead of parallel architectures. Technology can absorb execution complexity, but not the cost of duplicated governance, qualification, legal interpretation, and management time.
2030 — split but manageable. Most large global companies operate explicit China+1 or bloc-balancing strategies. Regional redundancy is built first in critical categories; AI-assisted planning is standard; connector countries face their first major wave of rules-of-origin investigations.
2040 — parallel by design. Parallel compliance regimes and regionally sovereign networks are normal for strategic categories. Competitive advantage is defined by how efficiently firms manage duplication under unified governance — R&D funded once and deployed regionally, capital shifted to where returns are highest, scarce talent rotated across hubs. The winners learn to run parallel operations under one roof, rather than fragment into weaker regional players.
Geopolitics is tense but manageable; the dominant reshaping forces are the economics of carbon, route reliability, and transport costs. Long-haul movement becomes structurally more expensive in real terms, and the premium for proximity becomes a mainstream planning assumption rather than a resilience niche.
- Carbon pricing becomes a hard cost variable in sourcing and network optimization, driving regional hub structures and circular loops.
- Long-haul air freight becomes hard to justify except for urgent or value-dense goods; transport-intensive lanes are redesigned or consolidated.
- Supply chain finance and insurance costs reinforce the proximity premium for routes through contested waters.
- Critical mineral scarcity intensifies competition for battery metals and rare earths.
- Circularity regulation at its most binding: digital product passports, mandatory recycled content, and end-of-life take-back.
Management risk. Asset stranding for companies locked into distance-based sourcing — plus a reindustrialization cost surprise, where the political will to nearshore runs ahead of the practical ability to execute (permitting, workforce, infrastructure).
2030 — carbon starts to bite. Carbon border adjustments, maritime decarbonization costs, and Scope 3 reporting materially influence sourcing. Early movers redesign trade lanes and nearshore transport-heavy categories.
2040 — proximity becomes price logic. Carbon is embedded in total landed cost by default. Regional hub structures and circular flows are mainstream; the strongest operators differentiate through carbon-efficient network design.
Geopolitical fragmentation eases or remains bounded, automation scales successfully, and low-cost clean energy reduces the economic penalty of distance. Global networks persist — but they are organized around data quality, orchestration quality, and algorithmic advantage rather than labor-cost arbitrage.
- Global networks remain viable in more categories; AI-native planning and autonomous coordination become major differentiators.
- Inventory can be lower because visibility, responsiveness, and predictability improve.
- Competitive advantage shifts toward data quality, digital control towers, and operating intelligence.
- The AI infrastructure supply chain becomes the critical enabler: access to energy, compute, and skilled people determines which regions host the intelligence layer.
Management risk. Strategic overcommitment — companies that plan only for this world remain exposed if fragmentation persists. A subtler risk is concentration: trading geographic supply chain risk for dependency on a few hyperscaler platforms.
2030 — automation ahead of alignment. Leaders show meaningful productivity gains, but most firms are still redesigning processes around AI-native planning. The AI infrastructure build-out advances rapidly but unevenly.
2040 — intelligence rewrites distance. A transformative AI breakthrough could shift the competitive logic decisively from physical proximity to data quality, algorithmic capability, and compute access — making globally distributed systems competitive again. The winners built the data foundation and organizational confidence before the breakthrough arrived.
Fragmentation intensifies while AI and robotics fail to scale fast enough to offset rising complexity. Supply chains become more expensive, more brittle, and more dependent on buffers, manual firefighting, and politically safe but economically suboptimal choices. The failure mode is specific — automation stalls because three reinforcing bottlenecks prevent it from scaling: a constrained AI infrastructure supply chain, organizational readiness that does not keep pace, and tightening talent markets as demographic decline accelerates.
- Forced network duplication without productivity relief; higher inventories and more strategic stockholding.
- Growing labor stress, planning friction, and crisis-management load.
- State influence, localization mandates, and loss of optionality in critical categories.
- Supply chain finance becomes a constraint rather than an enabler; critical mineral shortages compound technology delays.
Management risk. Drift. Companies slide into this scenario through stalled digital programs, repeated exceptions, supplier concentration, and rising compliance costs without resilience gains. Watch for growing manual-override rates, stalled automation pilots, chronic talent attrition, and rising working capital without service improvement.
2030 — buffers before breakthroughs. Companies build buffers and localize under pressure rather than through deliberate strategy; legacy-system costs rise while productivity gains stay concentrated among a few leaders.
2040 — fragility as the default. Supply chains are structurally more expensive and less intelligent. The gap between leaders and laggards widens into a structural divide.
4.5 Scenario migration over time
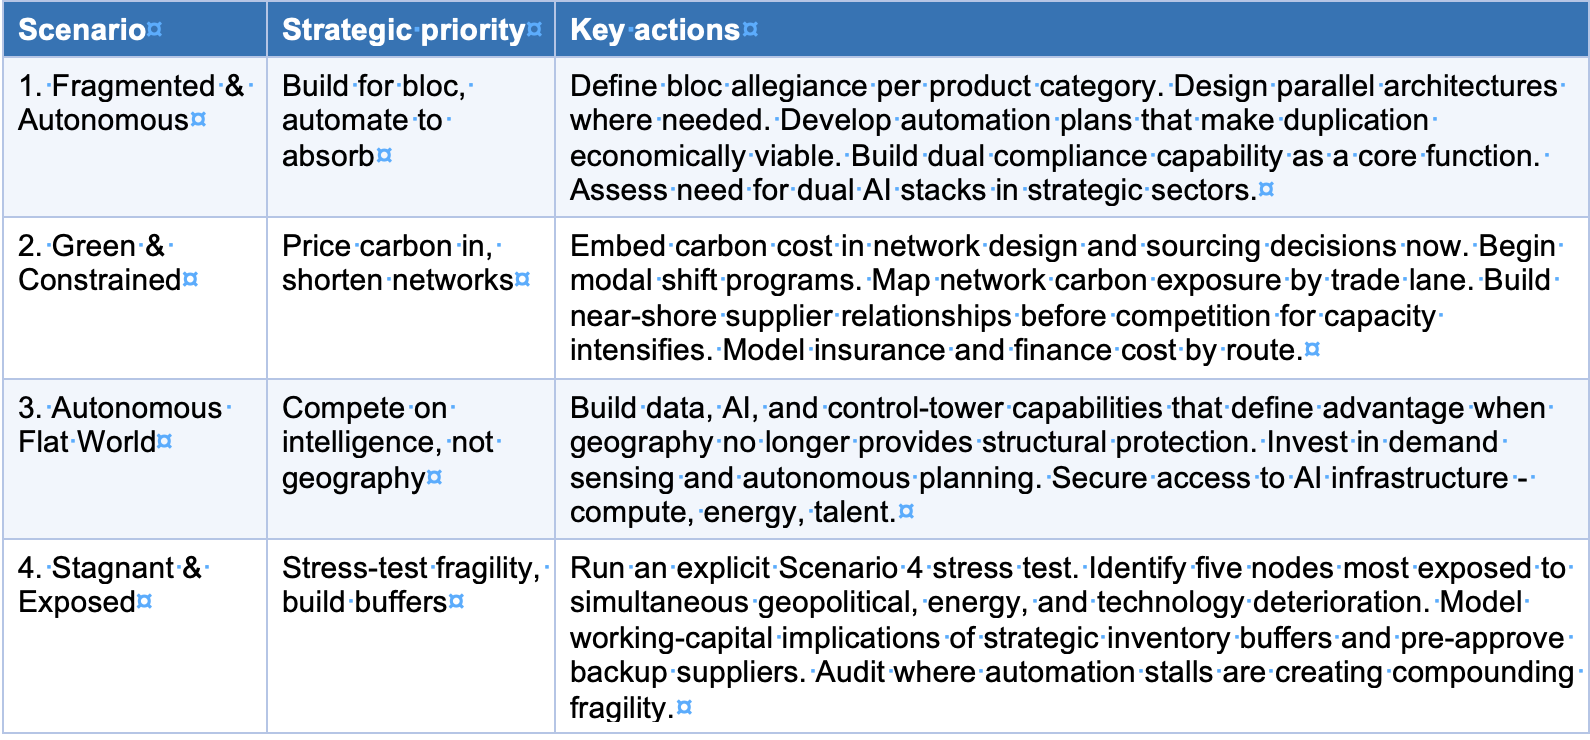
These scenarios are not static end states. The most plausible near-term trajectory begins in Fragmented & Autonomous. From there, an upward path toward an Autonomous Flat World opens if AI maturity accelerates and fragmentation stabilizes — the trigger to watch is a sustained decline in manual override rates combined with a plateau in new trade restrictions. A downward path toward Stagnant & Exposed opens if automation investment stalls while fragmentation intensifies — the trigger is rising override rates, stalled pilots, and accelerating export controls. Green & Constrained can emerge as the dominant case from any starting point if carbon pricing and energy costs rise faster than expected.
5. Implications for Companies
The framework is a strategic planning tool, not a forecast. Its value lies in forcing explicit acknowledgment of which future a company's current strategy is implicitly betting on, identifying which decisions are robust versus scenario-specific, and maintaining an early-warning system that tracks which world is gaining probability. Six steps provide guidance:
- Calibrate your current strategy. Which scenario is your existing network, technology plan, and supplier base implicitly designed for? Most companies discover they are betting on a benign version of the status quo.
- Identify irreversible decisions. Map assets, contracts, platforms, and supplier dependencies that lock you in — including digital dependencies that create lock-in.
- Sort upcoming decisions. Classify each as scenario-robust, scenario-specific bet, or hedge. If more than 60% of upcoming capital decisions bet on the same scenario, your portfolio is concentrated.
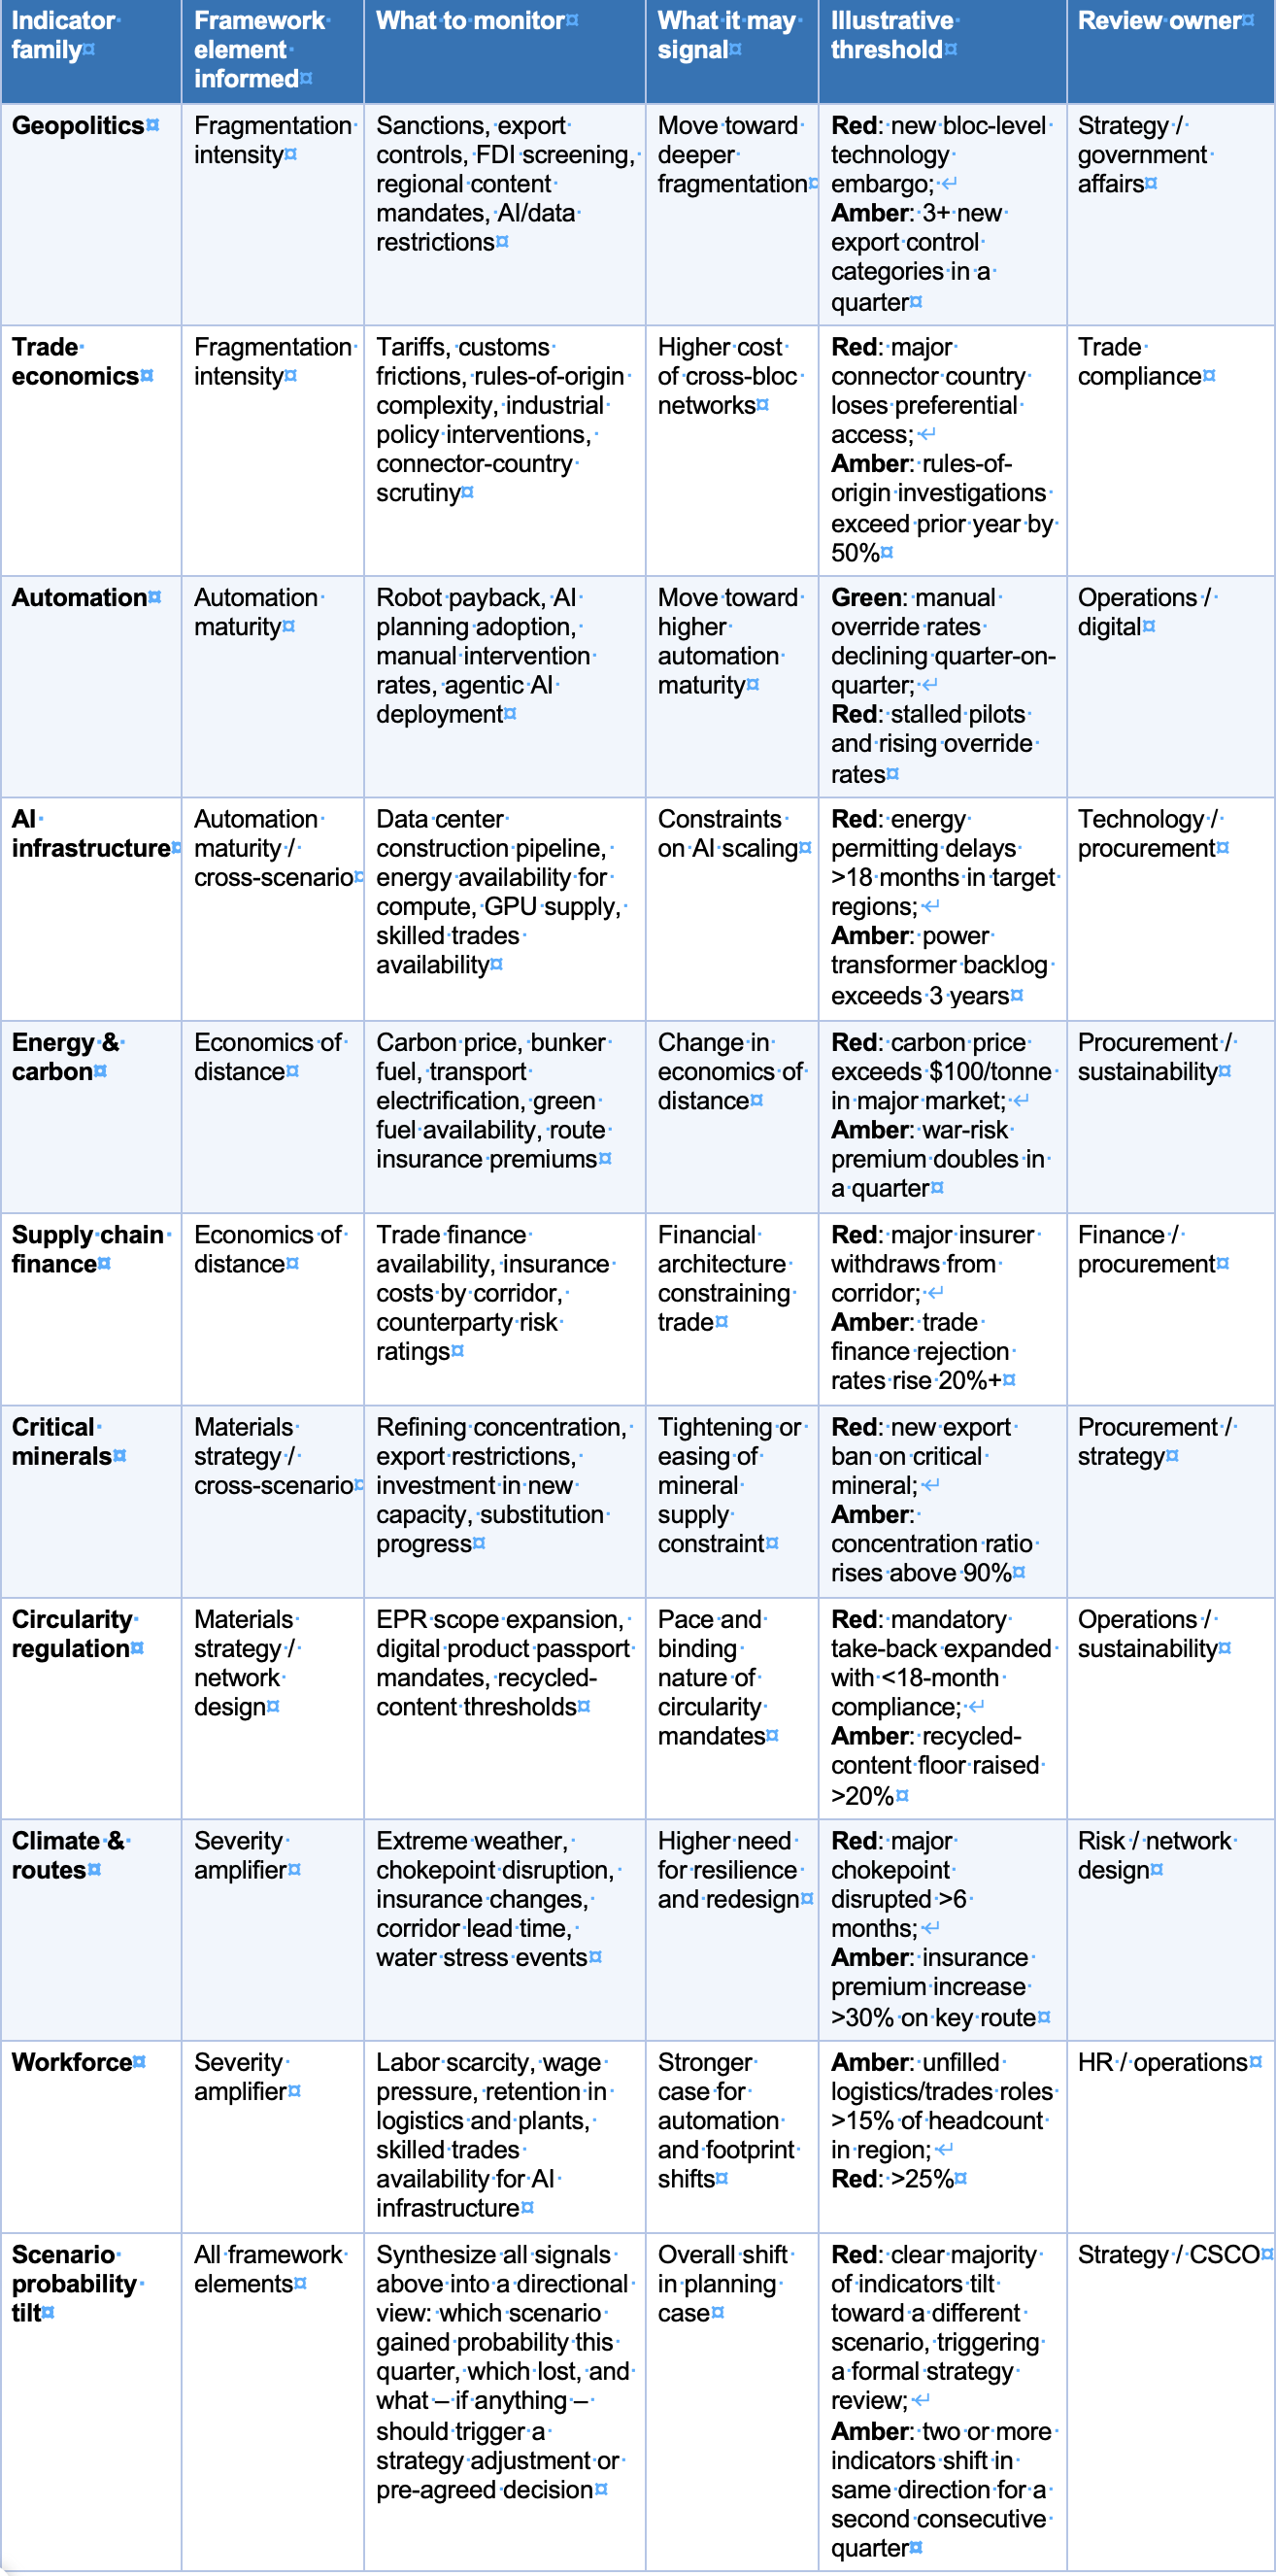
- Build an early-warning system. Agree on observable indicators for each driver, assign owners, and build a quarterly scenario review into S&OP and strategy governance.
- Stress-test against Scenario 4. Model the working-capital and service-level impact of operating for three years in a Stagnant & Exposed world.
- Align on your AI assumption. State your explicit assumption about transformative AI within your planning horizon, and test the 2040 strategy against both breakthrough-present and breakthrough-absent worlds.
5.1 Scenario-robust actions (the no-regret moves)
Seven actions are common to all scenarios. The objective of supply chain strategy in this environment is not the lowest total landed cost — it is the lowest reconfiguration cost. This framing makes modularity, pre-qualified alternatives, and digital foundations first-order strategy, not risk overlays.
- Design for modularity rather than point optimization. Test: can you activate a pre-approved alternative network configuration for your top five product categories within 90 days?
- Requalify suppliers in exposed categories before urgency removes choice. Test: for your top 20 suppliers in geopolitically exposed categories, do you have a qualified, tested alternative with confirmed capacity?
- Build a usable data foundation. Test: can your planning system run a credible scenario analysis across your full network within one working week, without manual data assembly?
- Treat automation as a strategic absorber of complexity, not only an efficiency program. Test: does your automation roadmap include resilience and complexity absorption as success metrics?
- Embed carbon, energy, and financial assumptions directly in network and sourcing models. Test: does your total landed cost model include carbon cost, war-risk insurance, and financing cost by corridor?
- Integrate geopolitical and AI-infrastructure intelligence into supply chain governance. Test: does your quarterly S&OP review include a structured geopolitical and technology signpost update?
- Map critical mineral exposure and build circularity into network design. Test: can you trace the critical mineral content of your top 10 product categories to refining-country level, and do you have a reverse-logistics plan that meets the regulatory trajectory in your primary markets?
For the Scenario 4 stress-test, calculate three numbers for each critical node — Days of Awareness (how quickly you would detect a disruption), Days of Survival (how long you can hold target service without the disrupted element), and Days of Recovery (how long to restore normal operations). Companies with short Days of Survival and long Days of Recovery are carrying optionality risk they cannot yet see in their P&L.
5.2 Signposts and monitoring dashboards
Scenario planning only becomes operational when management agrees on what to watch and why. The monitoring system works best in two layers. The first — the scenario signpost dashboard — is external: it tracks macro-level forces to assess which scenario is gaining or losing probability. The second is internal: it tracks the company's own readiness to act on what the signals imply. Both are required. A company that monitors the world perfectly but lacks reconfiguration capability is not resilient — merely well-informed. Each indicator family should be tracked against green / amber / red threshold bands, producing a one-page quarterly scenario-tilt assessment.
Conclusion
The future of supply chains will not be determined by one master trend. It will be shaped by the interaction of politics, technology, energy economics, critical resource scarcity, circularity regulation, route security, and — increasingly — the physical infrastructure required to power the intelligence layer itself. The central managerial challenge is not to predict a single outcome with false precision. It is to build a supply chain strategy that is explicit about its assumptions, robust where it should be robust, selective where it must take bets, and adaptive enough to move as the evidence changes.
The companies that outperform will not be those that guessed perfectly. They will be those who designed optionality early, built a monitoring discipline, invested in data and automation where it matters, and treated supply chain strategy as a live capability rather than a periodic exercise.
The strongest near-term evidence points to a more policy-driven, operationally constrained, and financially complex environment than many companies still assume. The connector-country model that underpins many China+1 strategies is under growing strain, and the gap between companies that have built data foundations, automation capability, and scenario discipline and those that have not is widening in ways that will be difficult to reverse.
Appendix & Dashboard
For the full indicator evidence base, the source stacks and policy trackers worth monitoring, and the internal readiness KPI dashboard, see the companion Appendix & Dashboard — additional sources, KPIs, and a dashboard built as a working aid for supply chain professionals.